Events
A single timeline of everything Hugin and your tools did — scans, crawls, errors, and scope blocks — so you can retrace a session or pin down where it broke.
Something in your session went sideways — a scan stalled, a workflow filled with errors, requests stopped landing. Events is the one place that shows you, in order, everything Hugin and your tools did, so you can retrace the run and find where it broke. It sits in the Logging group and is free in Community.
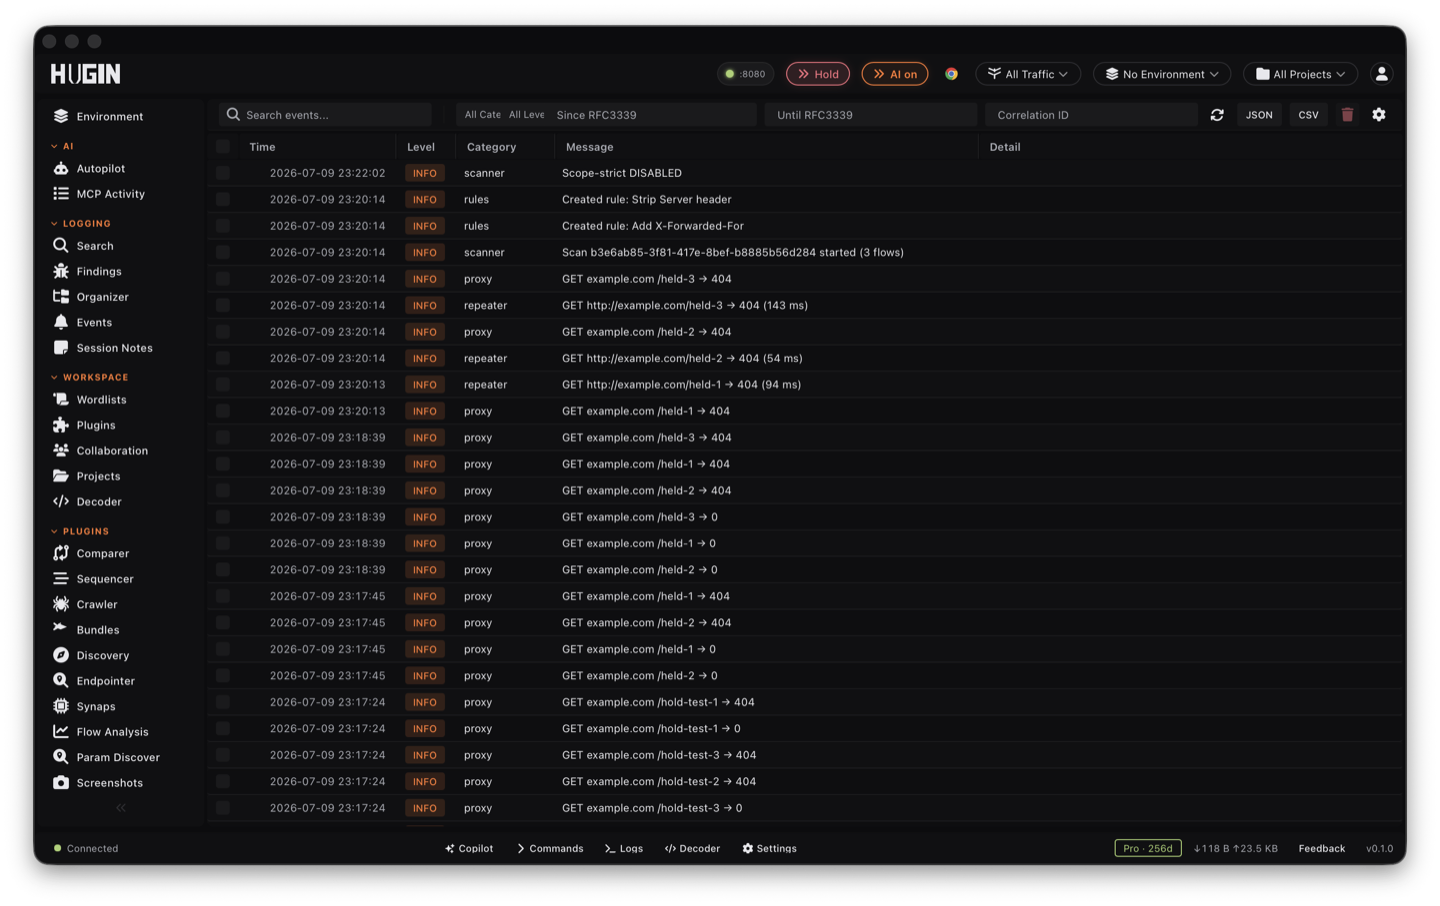
What lands in the log
Every event carries a category naming the part of Hugin that produced it. The common ones:
Traffic Hugin captured, and out-of-scope requests it refused to forward when scope blocking is on.
A scan starting, finishing, or failing.
A crawl walking the target's pages and forms.
Your automated runs kicking off and completing.
Session macros, intercept actions, and out-of-band (OOB) callbacks.
Hugin Browser navigation and WebSocket activity.
Category is open-ended, so the filter dropdown lists exactly the categories present in your log right now — a quiet session shows fewer than a busy one.
What each row shows
Five columns: Time, Level, Category, Message, and Detail. Drag to resize them, or use the column menu to hide the ones you don't need. Behind each row sits a correlation id — filter on it to pull together every event from one operation, like a single scan run from start to finish.
Each event has one of 4 levels: Info, Warning, Error, and Success — shown as INFO, WARN, ERROR, and OK. The error rows are where a scan or a workflow fell over, and the correlation id on that row leads you back to everything else that run touched.
Filter down to what matters
The toolbar narrows the list every way you'd want:
Matches the message, detail, and category text, plus the metadata and correlation id stored with each event.
Pick one category and one level to isolate, say, every scanner error.
Bound a window with RFC 3339 timestamps to focus on the minutes a bug appeared.
Paste an id to see only the events from that one run.
The view shows the latest 500 matches. When something scrolled past, tighten the filters or set a time window to reach further back.
Watch it live
New events stream in at the top as they happen — no refresh needed. The view keeps the 500 newest; older rows scroll off but stay in the log, reachable by filtering or a time window. Hit refresh to re-pull the list and its counts. Hugin keeps running counts per category and level, which is what fills the category filter.
Export, clear, and prune
Export JSON or CSV — both copy the current, filtered view to your clipboard, ready to paste into a report or a ticket.
Clear All wipes the entire log. Delete Before takes an RFC 3339 timestamp and prunes everything older — handy to drop a previous target's noise before a fresh hunt. Both are destructive and cannot be undone.
Events, Activity, or Findings?
Three logs, three altitudes — don't confuse them:
The whole-session timeline of what Hugin and your tools did. You are here.
What an AI agent did over MCP — every tool call and the requests it fired. See MCP Activity (Pro).
The confirmed vulnerabilities worth reporting. See Findings.
A scan touches all three: the run shows up in Events, the vulns it confirms land in Findings, and if you drove the scan from an agent, its tool calls show in MCP Activity. Start a scan from the Scanner; come to Events when it doesn't behave.