Scan a target
Run Hugin's 55 active and 48 passive checks against a flow, a host, or live as you browse — with scan profiles, rate presets, and findings backed by differential and out-of-band proof.
The Scanner runs Hugin's built-in checks against your target — 55 active checks and 48 passive checks. It is part of Community, not a paid add-on. It confirms a bug instead of guessing at one — every finding carries the request and response that proved it. Scan for breadth and confirmation, then take a finding into Repeater to escalate it by hand.
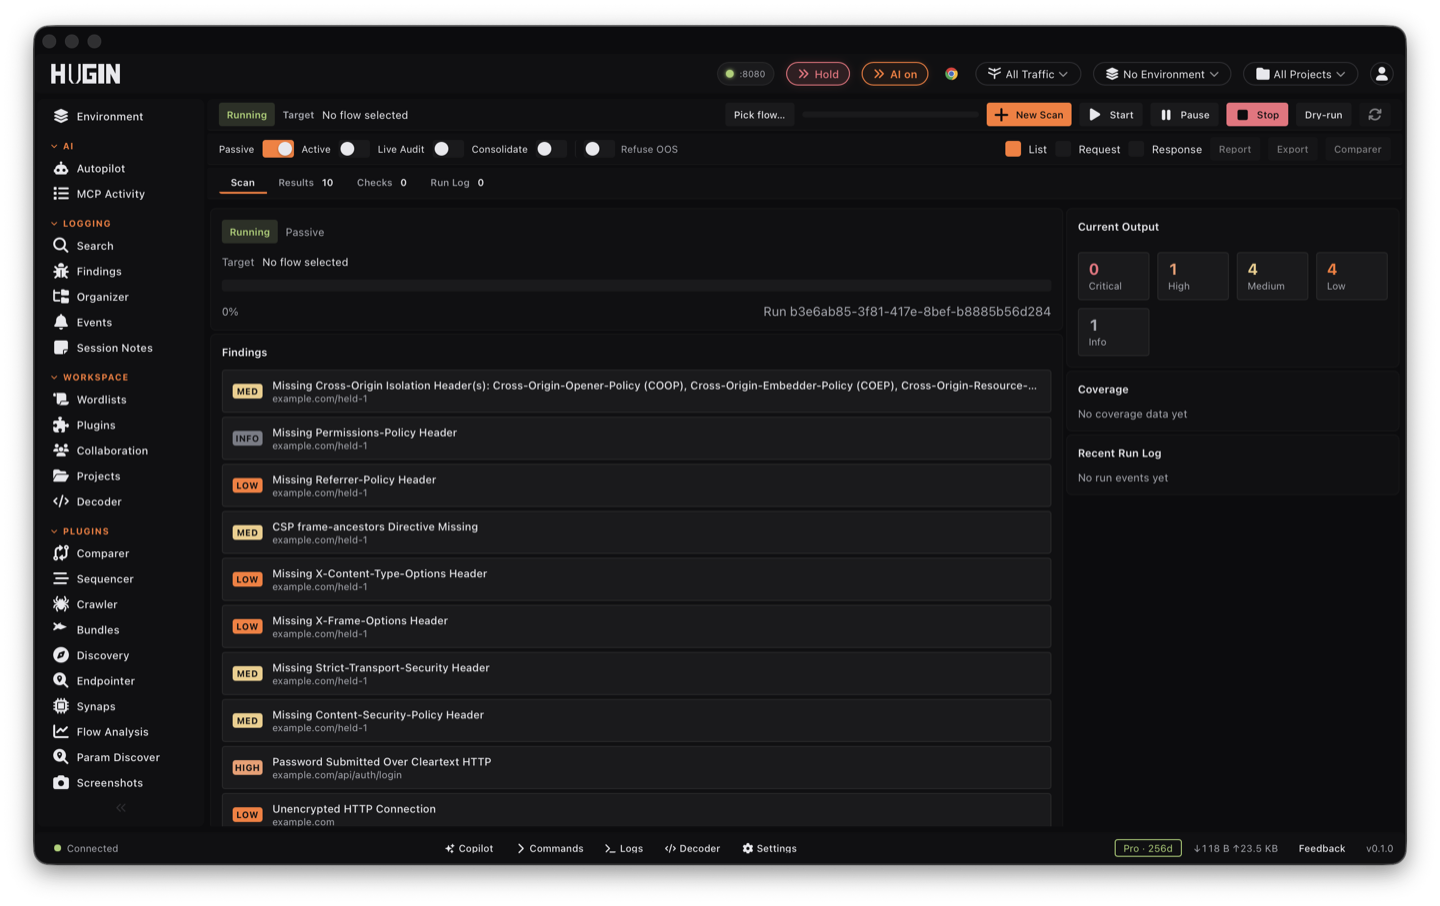
Two ways to scan
Scan a single flow
Right-click a flow in History and send it to the Scanner. Good when you have one endpoint to check thoroughly.
Scan a host
Crawl the target first, then scan everything in scope. Good for breadth across the app. Set scope before you start.
Pick a scan profile
A scan profile sets what the Scanner does to the target: how many payloads it sends per insertion point, which checks run, and whether it uses timing probes, out-of-band callbacks, and state-changing writes. It is a separate dial from the resource presets below, which tune the request rate. Four profiles are shaped for a specific job:
One request at a time, a 500 ms floor between requests, no timing probes and no out-of-band callbacks — a burst of DNS lookups is the fastest way to trip a WAF. Pick it for targets fronted by DataDome, PerimeterX, or any WAF that blocks on volume.
Active checks that never change state — no writes, no destructive payloads, so it skips things like SQLi DELETE payloads and file upload. Pick it when you are cleared to test but not to modify data.
Fast and shallow, the high-impact classes only (SQLi, XSS, command injection, SSRF, XXE, SSTI, deserialization), with no timing or out-of-band probes. Pick it for a pipeline gate that has to finish quickly.
Full payload depth plus timing and out-of-band probes, narrowed to the highest-severity classes (SQLi, command injection, SSRF, XXE, SSTI, deserialization, HTTP smuggling, race conditions, JWT). Pick it for a deep pass that ignores low-severity noise.
The rest set depth rather than shape:
- Quick — 2 payloads per insertion point, no timing or out-of-band probes. A first look.
- Light — a representative payload per class, timing and out-of-band kept on. A first pass over a large scope.
- Normal — the default: the full payload set with timing and out-of-band confirmation.
- Thorough — every payload, longer time-based delays, and retries. It is the one profile that turns on write and destructive payloads, so selecting it is your explicit go-ahead to change state.
- Passive-only — no probing at all; it reads the traffic it already sees.
Rate it to the target
The Scanner runs concurrently with a per-host sub-limit and rate limiting, and backs off on 429/503. Pick a resource preset for the target:
- Default — 5 concurrent, 3 per host, a 100 ms inter-request delay, throttles on 429.
- Aggressive — 20 concurrent, 10 per host, no delay, no throttle.
- Gentle — 1 at a time, 500 ms delay, ~2 requests/second.
A running scan can be paused, resumed, or cancelled, globally or by scan id.
Scan as you browse
Turn on Live Audit and the Scanner works the traffic you generate by hand:
every new in-scope request you make while browsing gets scanned automatically,
with no send-to-Scanner step. It scans each endpoint once — it normalizes ids in
the path, so /users/123 and /users/456 count as the same route — and it skips
out-of-scope hosts and known CDN, analytics, and tracker domains so it does not
burn requests or raise findings on infrastructure you do not control. It is off
until you start it. Set your scope first; scope is what
keeps it on-target.
It confirms, it doesn't guess
For boolean and blind bugs that show no error message, the Scanner sends a true condition and a false condition and compares each response against a clean baseline. It reports only when the true response tracks the baseline and the false one diverges by a real margin — the same true/false differential you would read by eye in Repeater, run for you on every insertion point. It compares by content type, so JSON is matched on structure and HTML on its tag skeleton rather than byte-for-byte, and you can hand it ignore patterns to strip CSRF tokens, timestamps, and nonces so churn in dynamic pages does not flip the verdict.
When a probe comes back as a WAF block — Cloudflare, Akamai, Imperva, DataDome, PerimeterX, and others — or a bot-challenge page that replaced the real response (even one served with a 200), the Scanner recognizes it and drops it instead of reporting the block as a bug. The WAF's own error pages stay out of your findings.
For blind classes that leave nothing in the response at all — SSRF, blind XXE, blind SQLi exfiltration, blind command injection, deserialization — the Scanner plants a payload that makes the target call back to a server you control. A callback that actually arrives is proof, not a guess, and the finding's confidence climbs each time it repeats. The default callback server is Oastify, built into Hugin; you can point the Scanner at your own Interactsh server or an existing Burp Collaborator instead. See confirming blind bugs with out-of-band callbacks.
The differential and WAF suppression run in the free Scanner. Out-of-band confirmation — Oastify, Interactsh, or Burp Collaborator — is a Pro feature.
Read the findings
Findings carry the request and response that proved them, a severity, and a remediation. Because the Scanner already drops WAF blocks and confirms blind classes, a finding is a lead worth escalating, not noise to wade through: open the proof in Repeater, reproduce it by hand, and build the report from there.
A scan sends real attack traffic, and active checks can change state. Keep it in scope, throttle fragile targets, and never scan a host you are not authorised to. Use Audit-only to stay read-only, or Stealth on a WAF-fronted target.
Next: what active and passive checks cover, or confirming blind bugs with out-of-band callbacks.