Site map
Browse the target as a host-and-path tree built from captured traffic, with findings and scope at a glance.
The Site map turns your captured flows into a navigable tree of hosts and paths — the structural view of the target, next to the flat HTTP History.
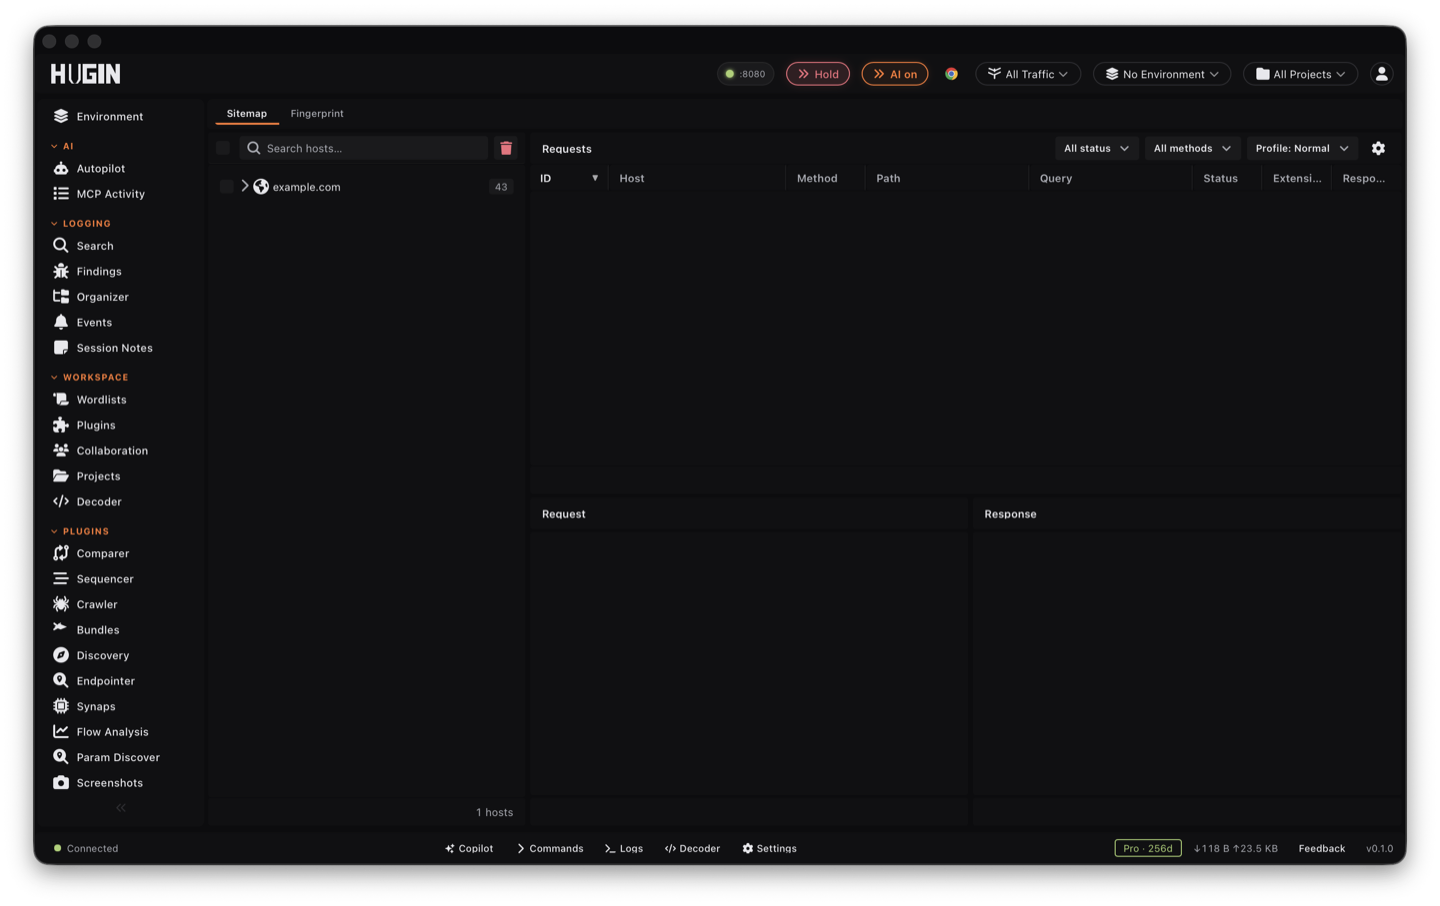
The layout
A three-pane view: the host tree on the left, the request table for the selected host in the middle, and the request/response detail on the right. The tree is built from the full dataset (counts and first/last-seen come from the server, not just the flows loaded on screen), and it carries overlays: scope colouring, scanner-issue badges per host and path, out-of-band callback markers, and a separate section for WebSocket connections.
Working from it
The request table shows method, path, query, status, extension, and response
length with {shown} of {total} paging. Right-click a host or request to send it
to a tool, add it to scope, filter findings to that host, or
export it.
The Site map is the fastest way to spot the shape of an app — which hosts exist, where the API lives, which paths already have findings — before you decide where to dig.
Filter, sort, and search the table
The middle pane is the request table for the selected host, with columns for ID, host, method, path, query, status, extension, and response length. Drag a column border to resize it, drag a header to reorder, and use the column menu to hide the ones you don't need — your layout persists. Click a header to sort, click again to flip the direction.
Narrow the rows with the filters above the table:
Show only 2xx, 3xx, 4xx, or 5xx responses — pull every server error or every redirect to the front.
Filter to GET, POST, PUT, PATCH, DELETE, OPTIONS, or HEAD — isolate the state-changing requests.
Hide everything outside your scope so the table shows only your real target.
Pick Quick, Normal, Thorough, Audit only, or Passive only. This sets the profile the right-click "Scan this branch" runs with.
The tree's search box ("Search hosts…") filters the host tree as you type. At 3 or
more characters it also greps every captured URL on the server and lists the
full-URL matches — click one to jump straight to the host and path it lives on.
It's the fast way to find every captured URL containing admin, /api/v2,
redirect=, or token across all hosts at once.
Per-flow actions
Right-click any row to act on that one flow:
Grab the URL, a ready-to-run curl command, or the raw HTTP request to paste into
a terminal or another tool.
Colour-tag the flow, or clear the tag, to mark the rows you're working.
Add the host to scope or exclude it. With a path selected, "Add to scope" scopes to that branch prefix, not the whole host.
Drop the flow from the project.
Send a single flow onward without leaving the map: Send to Repeater, Intruder, Comparer, or Sequencer; Open in Scanner; or Save to Organizer. The same Send-to buttons act on the selected row from the toolbar.
Work a whole branch
Select a host — or a path inside it — and the right-click acts on the whole subtree under that prefix instead of one row:
Active-scan every flow under the host or selected path with your chosen scan profile. Findings stream into the Scanner as they land.
Seed forced-browse with the host and path prefix — the scheme is inferred from traffic you've already captured.
Load every path in the subtree into the Authorize matrix and replay them as each identity in one pass — broken access control across the branch, not one endpoint at a time. (Pro)
Bulk-load every flow under the branch (up to 200) into Comparer to diff responses side by side.
You can also hand the branch to the next tool pre-seeded: send it to the Crawler to map more endpoints, to Match & Replace to rewrite its traffic, to Workflows as a trigger scope, to Flow Analysis, or to Param Discover. Scope another view to the host the same way with Filter Findings by host or Filter HTTP History by host.
Engagement tools
Right-click a host and run an engagement pass over the traffic you've already captured — no new requests, just analysis of what's in the project. Each result opens in a slide-over panel on the right with a Copy raw JSON button.
Every external script source and inline script block, so you know where to read the client-side code for secrets, sinks, and hidden endpoints.
HTML comments and JSON keys pulled from responses — leftover dev notes, commented-out endpoints, the occasional credential.
Who links to a URL (referrers) and where a page links out (outbound). Right-click a row, not a host node — it needs a flow URL.
Static versus dynamic URL counts, unique paths, and unique parameters, with histograms of the top parameters, extensions, content types, and methods — the attack surface at a glance.
Builds a forced-browse brief — target URL, wordlist, recommended concurrency, scope respected — ready to dispatch to discovery.
The engagement tools are Community.
DOM Invader from the Site map (Pro)
Hunt client-side bugs straight from a host node, against captured traffic — no need to open the Browser first. Right-click a host:
Finds prototype-pollution sources and the gadget chains they reach, with the sink, the polluted property, and a confidence score. Each gadget has live buttons: Verify runs the source in an isolated browser tab to confirm it, and Exploit fires the payload in your active tab.
Extracts message listeners from captured traffic, flags handlers that trust any origin and wildcard sends, and generates probe vectors — prototype pollution, DOM XSS, constructor-chain — to fire at each listener.
Lists clobbering targets, whether they bypass CSP, and ready-made injection templates. Copy templates to grab them, or Exploit to run a clobbering payload in the live tab.
Results open in the same slide-over. The live Verify and Exploit buttons drive a running browser session, so launch one from the Browser view first. DOM Invader is Pro — see DOM Invader for the full client-side workflow.
Export and AI analysis
Tick the hosts worth keeping and Export selected as Markdown, or export the whole map as JSON or CSV. Each export copies to your clipboard, ready for a report or another tool.
Analyze attack surface hands the host list and up to 50 endpoints to Autopilot with a prompt to flag interesting endpoints, likely vulnerabilities, and where to start. The AI analysis is Pro.
The Site map, its filters, search, and URL grep, the engagement tools, branch scans and discovery, and JSON, CSV, and Markdown export are Community. DOM Invader, the Authorize, Workflows, Flow Analysis, Param Discover, and HTTP History pivots, and AI analysis need Pro.